Skip to content
13F Flow

Beta · free while it runs

Follow the money institutions report.

Every SEC 13F filing, turned into a fast dashboard: what thousands of managers bought and sold this quarter, each firm’s full book, who owns every stock, and an AI that answers from the same data.

A firm page in 13F Flow.
The Pulse page in 13F Flow: every security's flow this quarter.
Holdings records
76.8M
Reported long value, 2026-Q2
$74.9T
Securities on the flow map
5,313
Years of daily prices
10+

The product

Two ways in: by firm, and by stock.

Start from a manager and see their whole book, or start from a ticker and see every institution that holds it. Every page is one click from the other.

Pulse

Every filer, one page.

What changed this quarter across every 13F filer: net flow, breadth, positions opened and closed, put and call filers. The flow map plots every security by change in holders against net flow, so concentrated accumulation and broad distribution stand out at a glance.

  • Flow map, sector map and table views
  • Most bought, sold, new and exited boards
  • Sector rotation and a smart-money grid
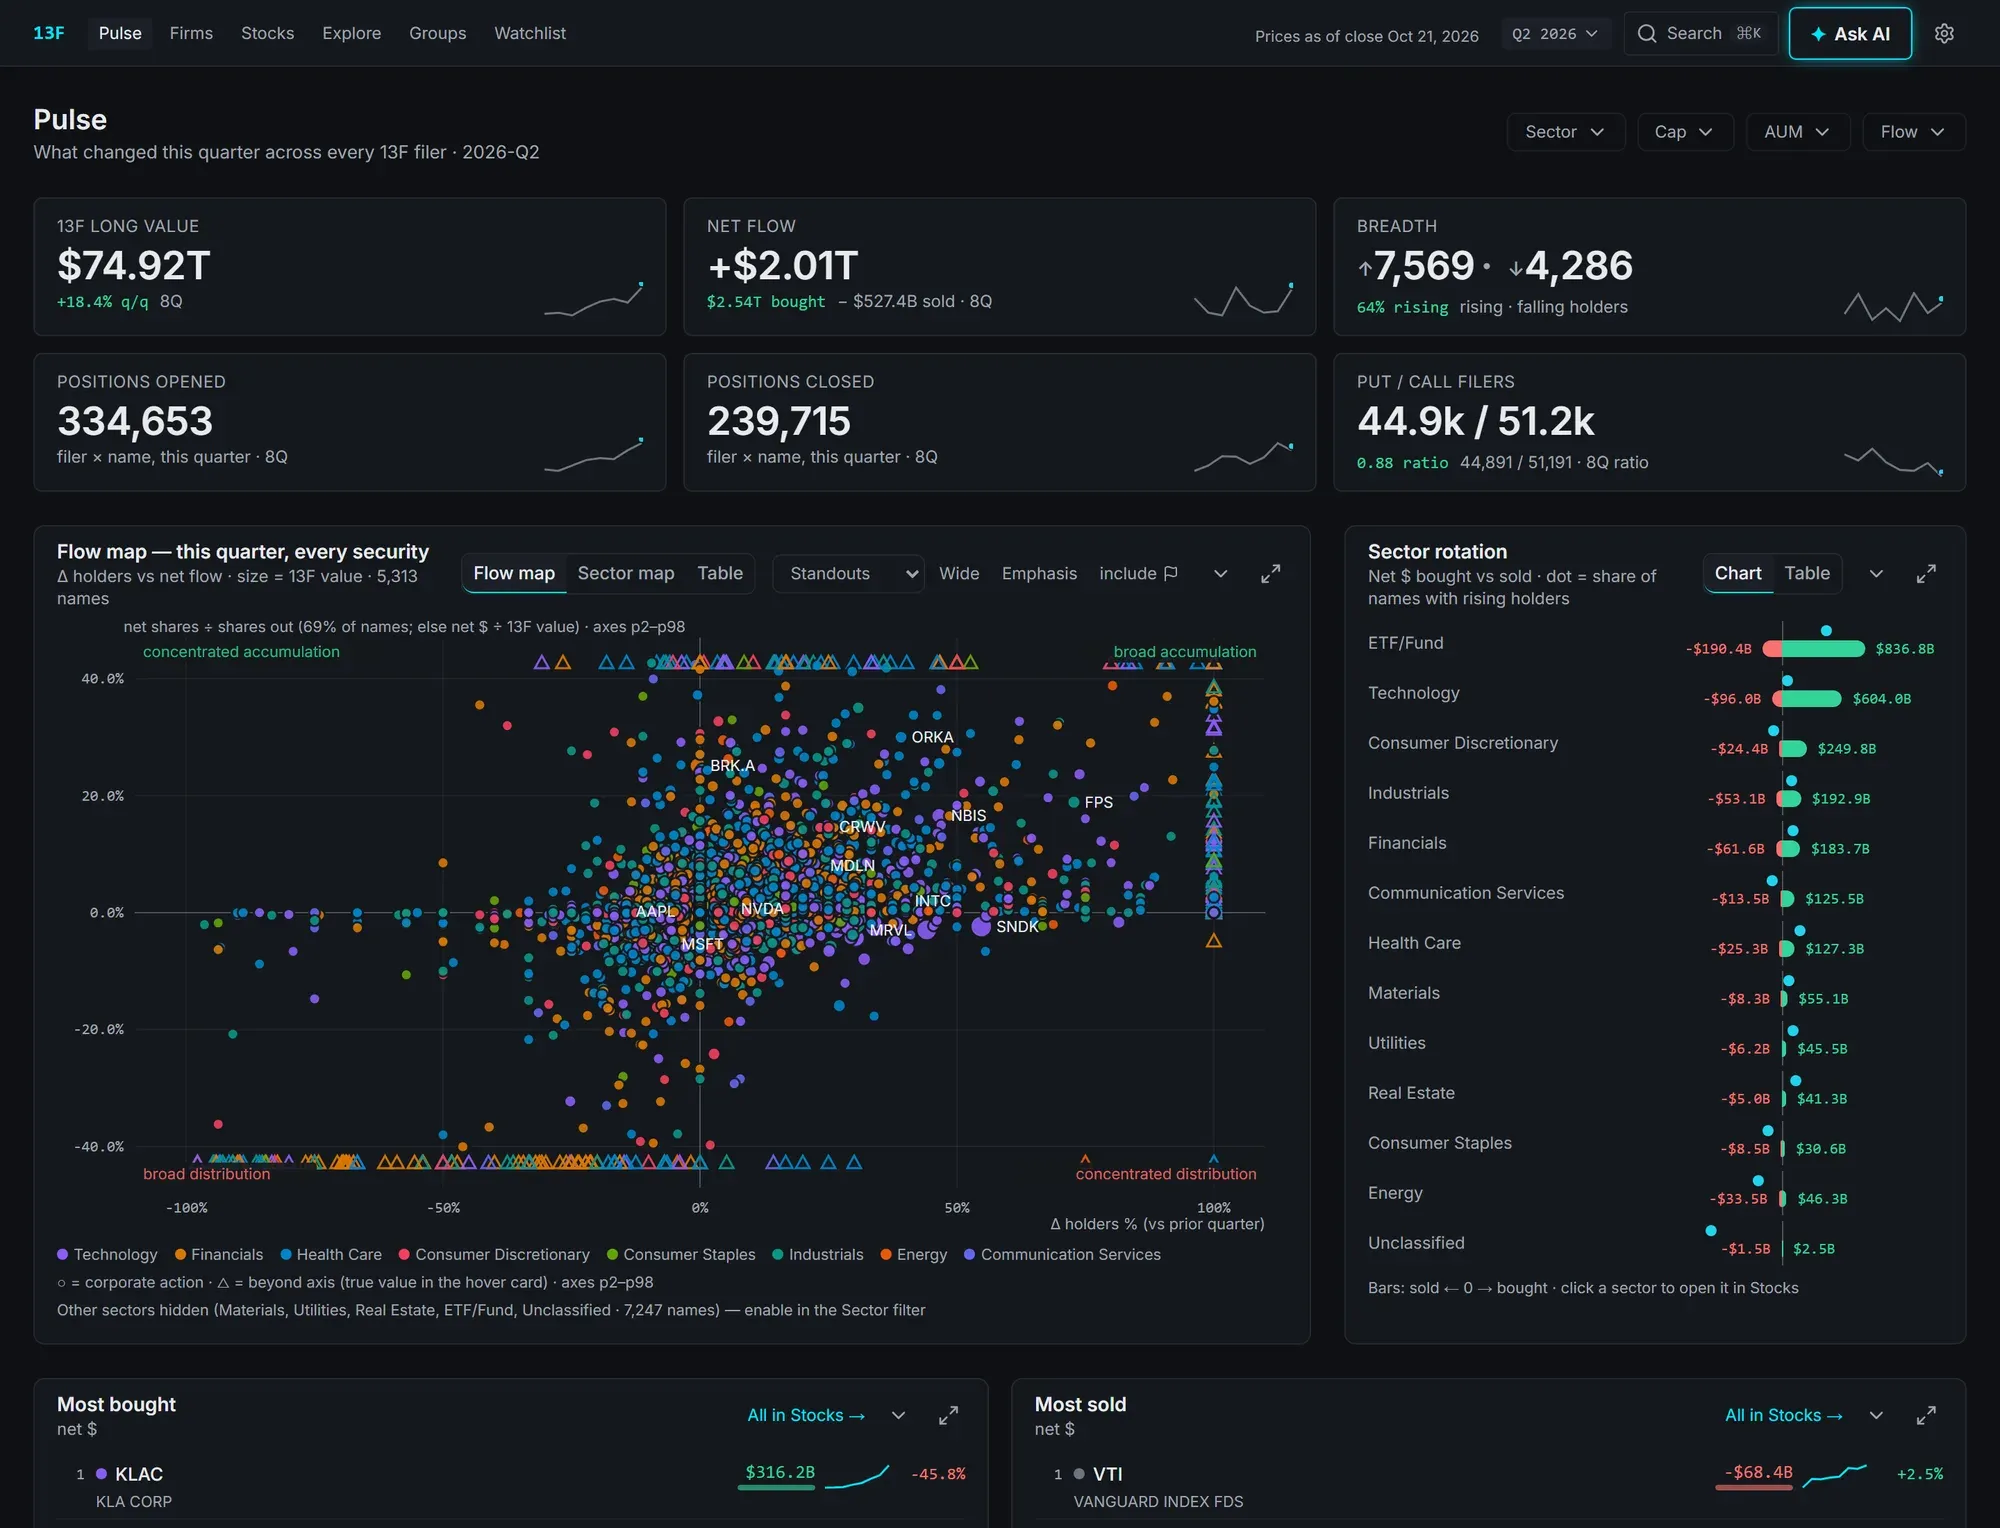
The Pulse page: KPI tiles, the flow map of every security and the sector rotation chart.

Firms

Read any manager’s book.

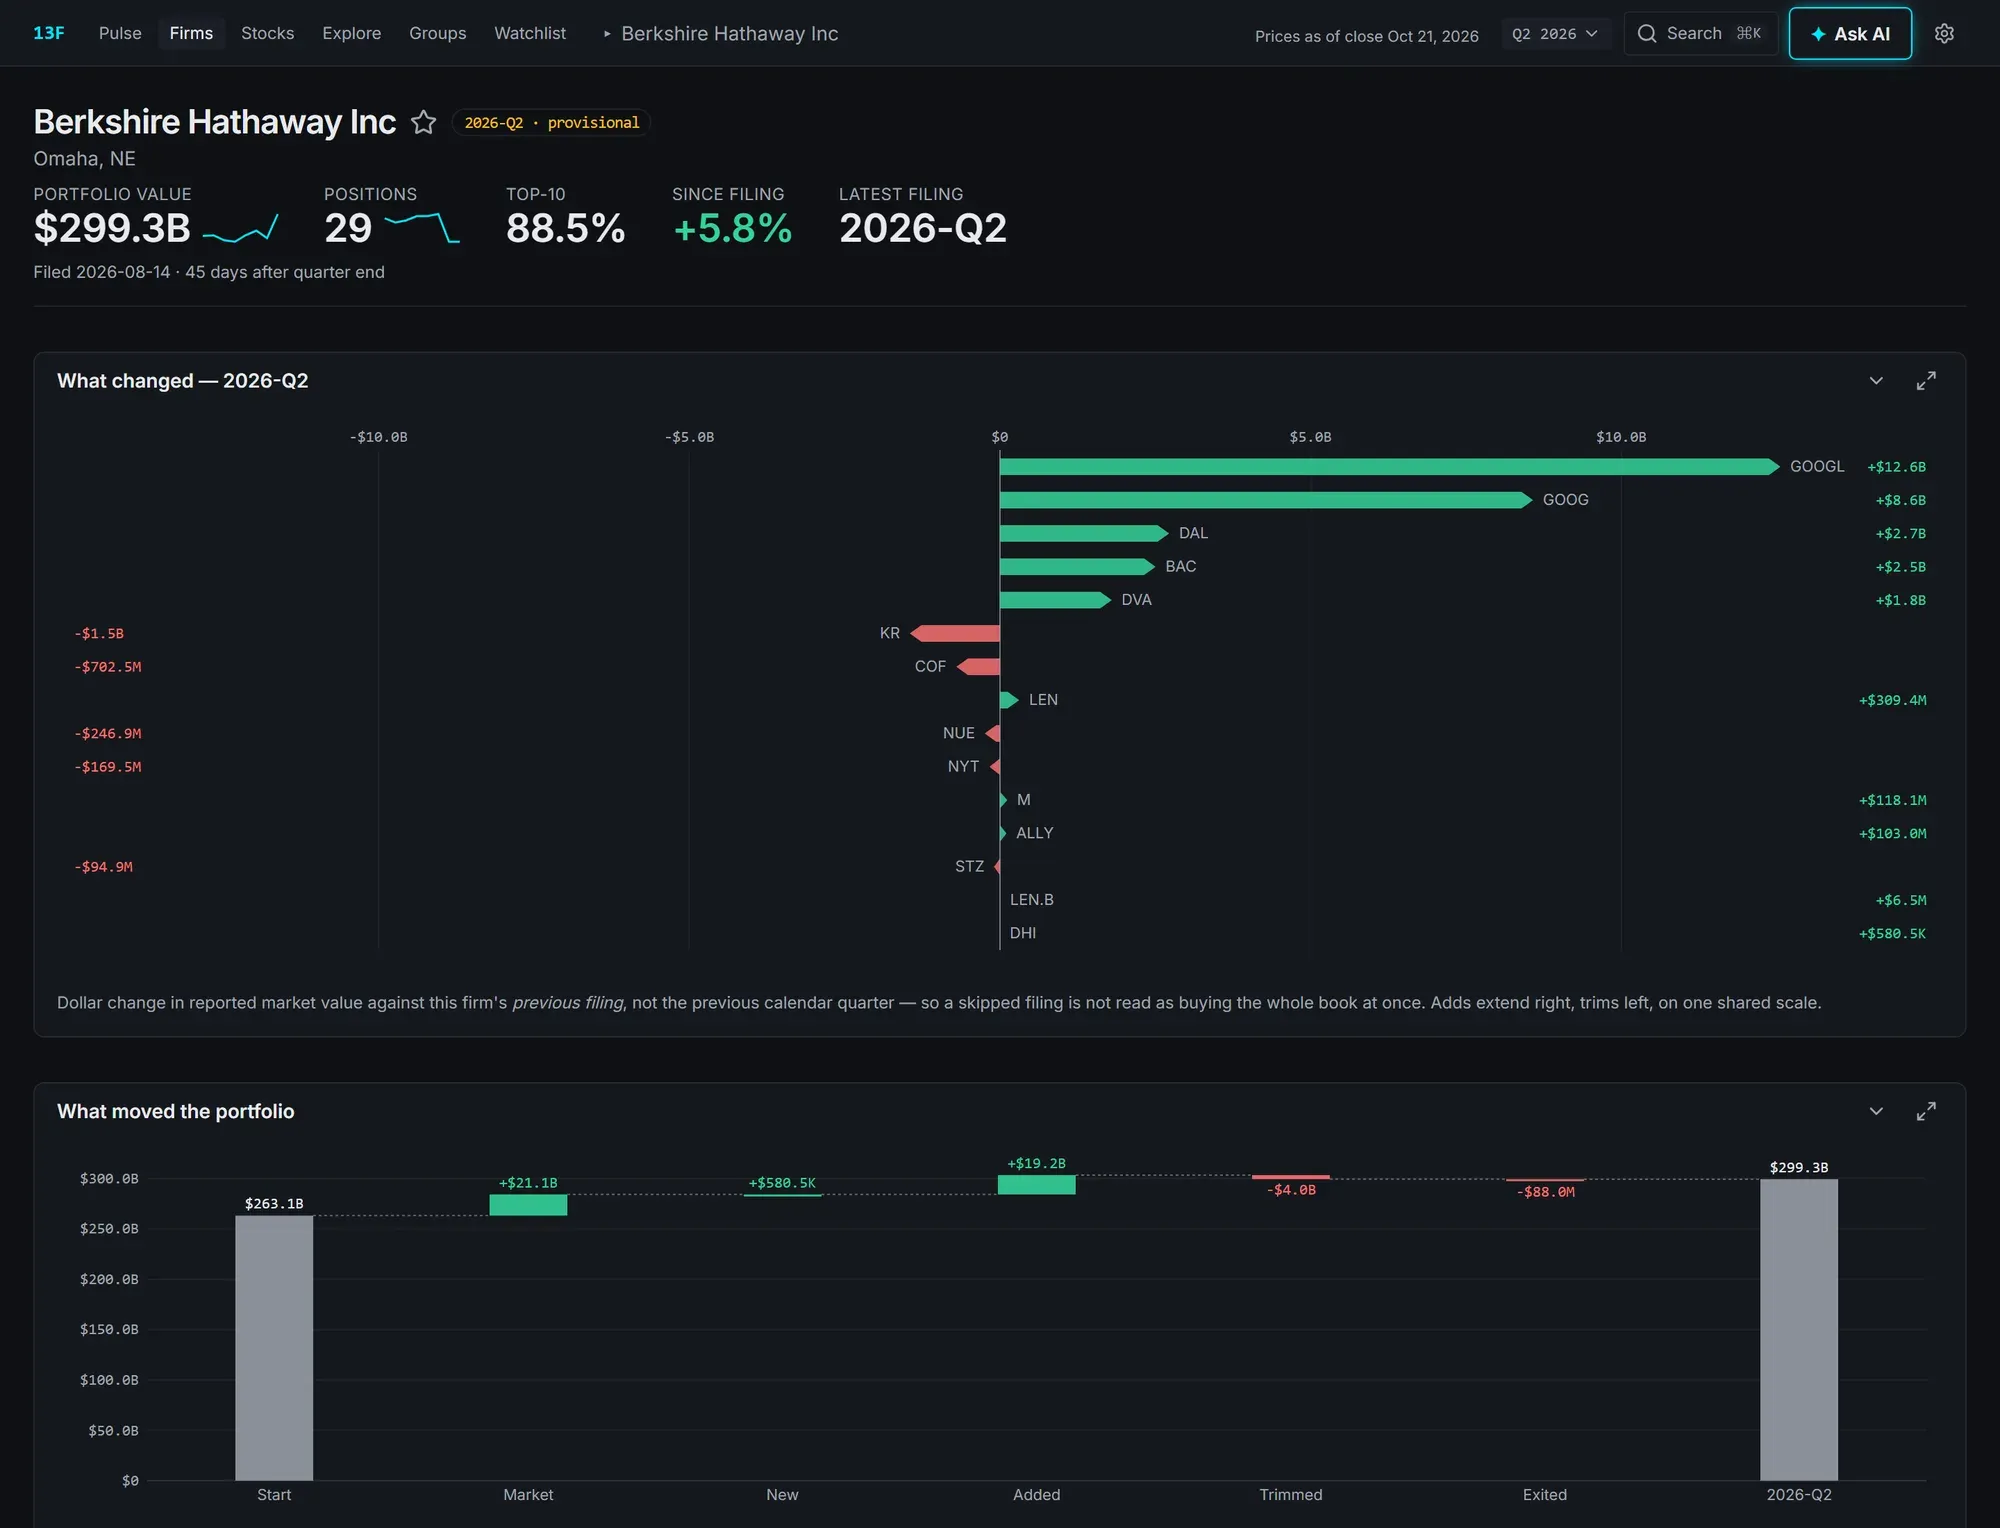
Portfolio value over time, holdings with per-row trend sparklines, what changed since the last filing, and how much of the move came from the market versus new money. A price-return clone compares the top ten against the S&P 500.

  • What changed, filing against filing
  • Options overlay: calls, puts and hedges
  • Clone vs S&P 500 and concentration gauges
A firm page for Berkshire Hathaway: portfolio value, what changed this quarter and what moved the portfolio.

Stocks

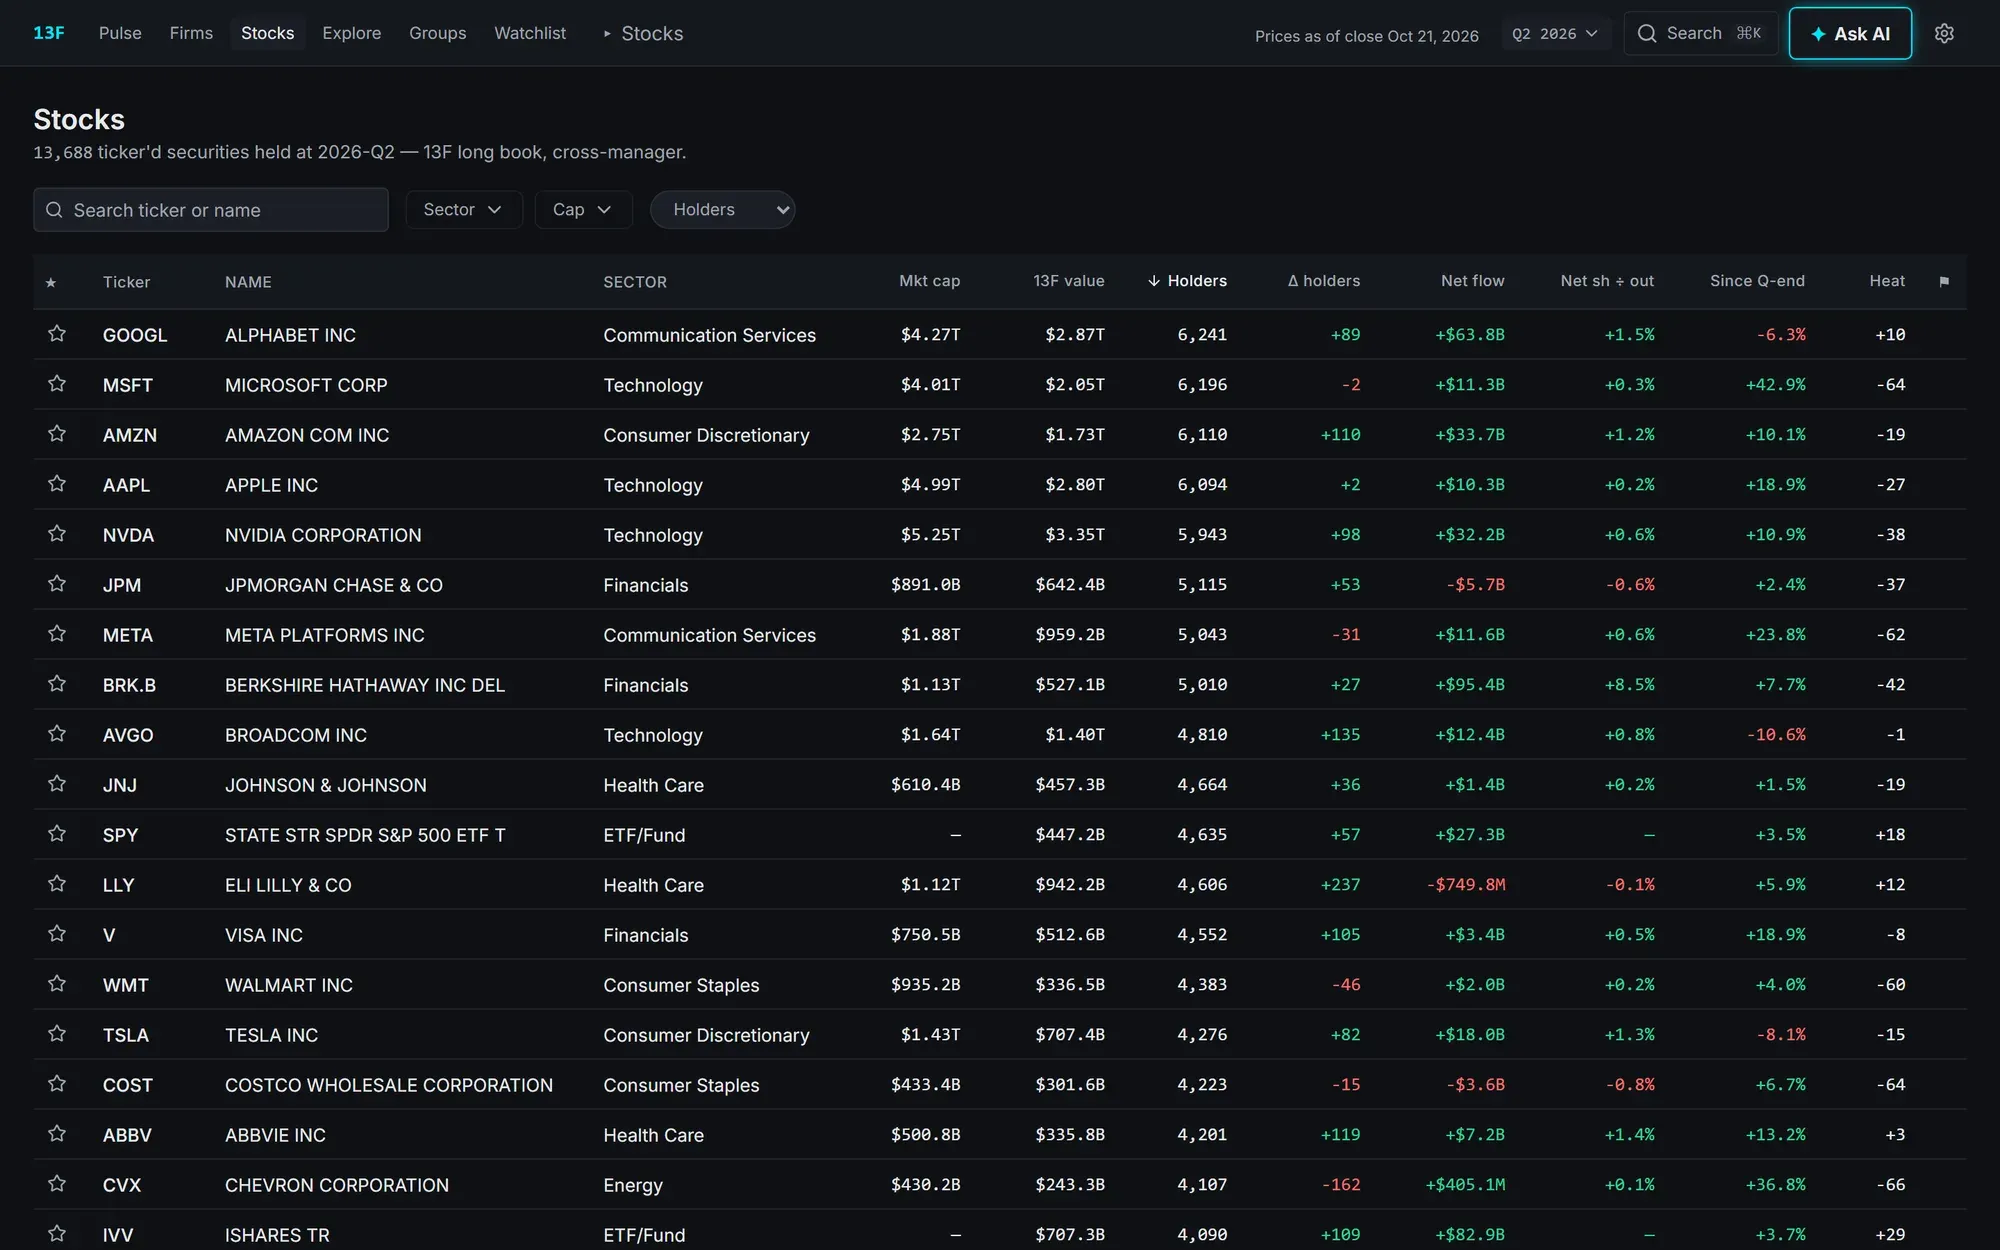
See who owns a stock, and who is moving.

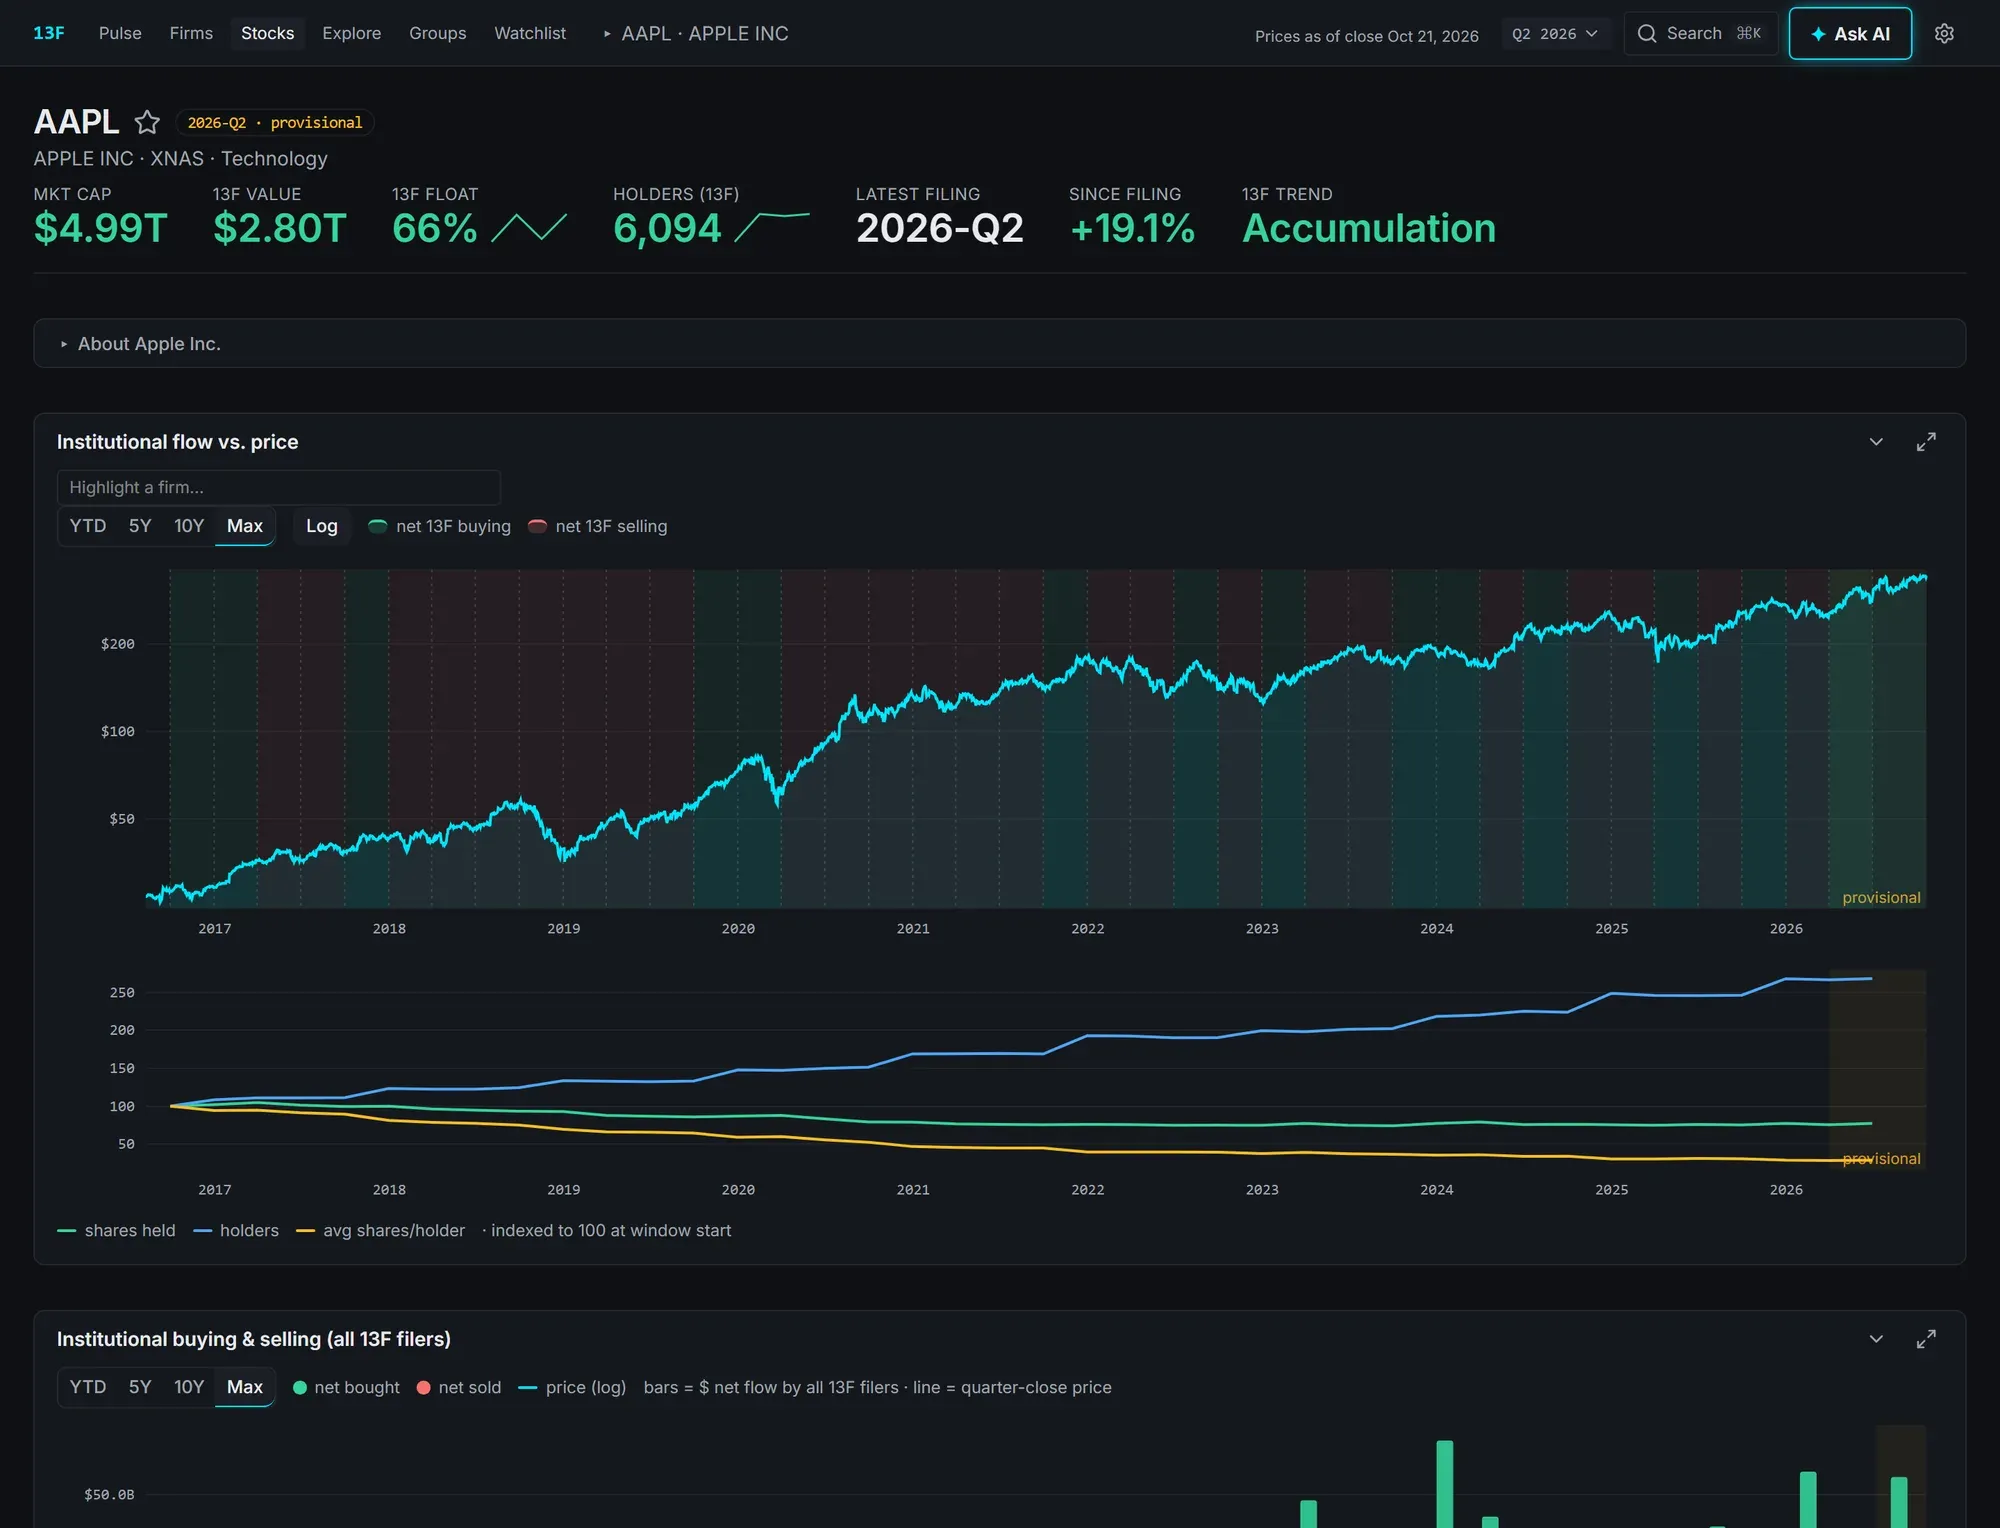
Market cap, 13F value, float held and holder count for every security, with institutional flow laid against price over ten years. Accumulation and distribution regimes are shaded right on the chart, and the holders table shows every filer.

  • Institutional flow vs price, back to 2016
  • Holders, activity and options positioning
  • Shares, holders and shares per holder, indexed
The Apple security page: KPI row, institutional flow against price and the ownership trend.

And everything around it

Directories, groups and a watchlist.

Fund groups

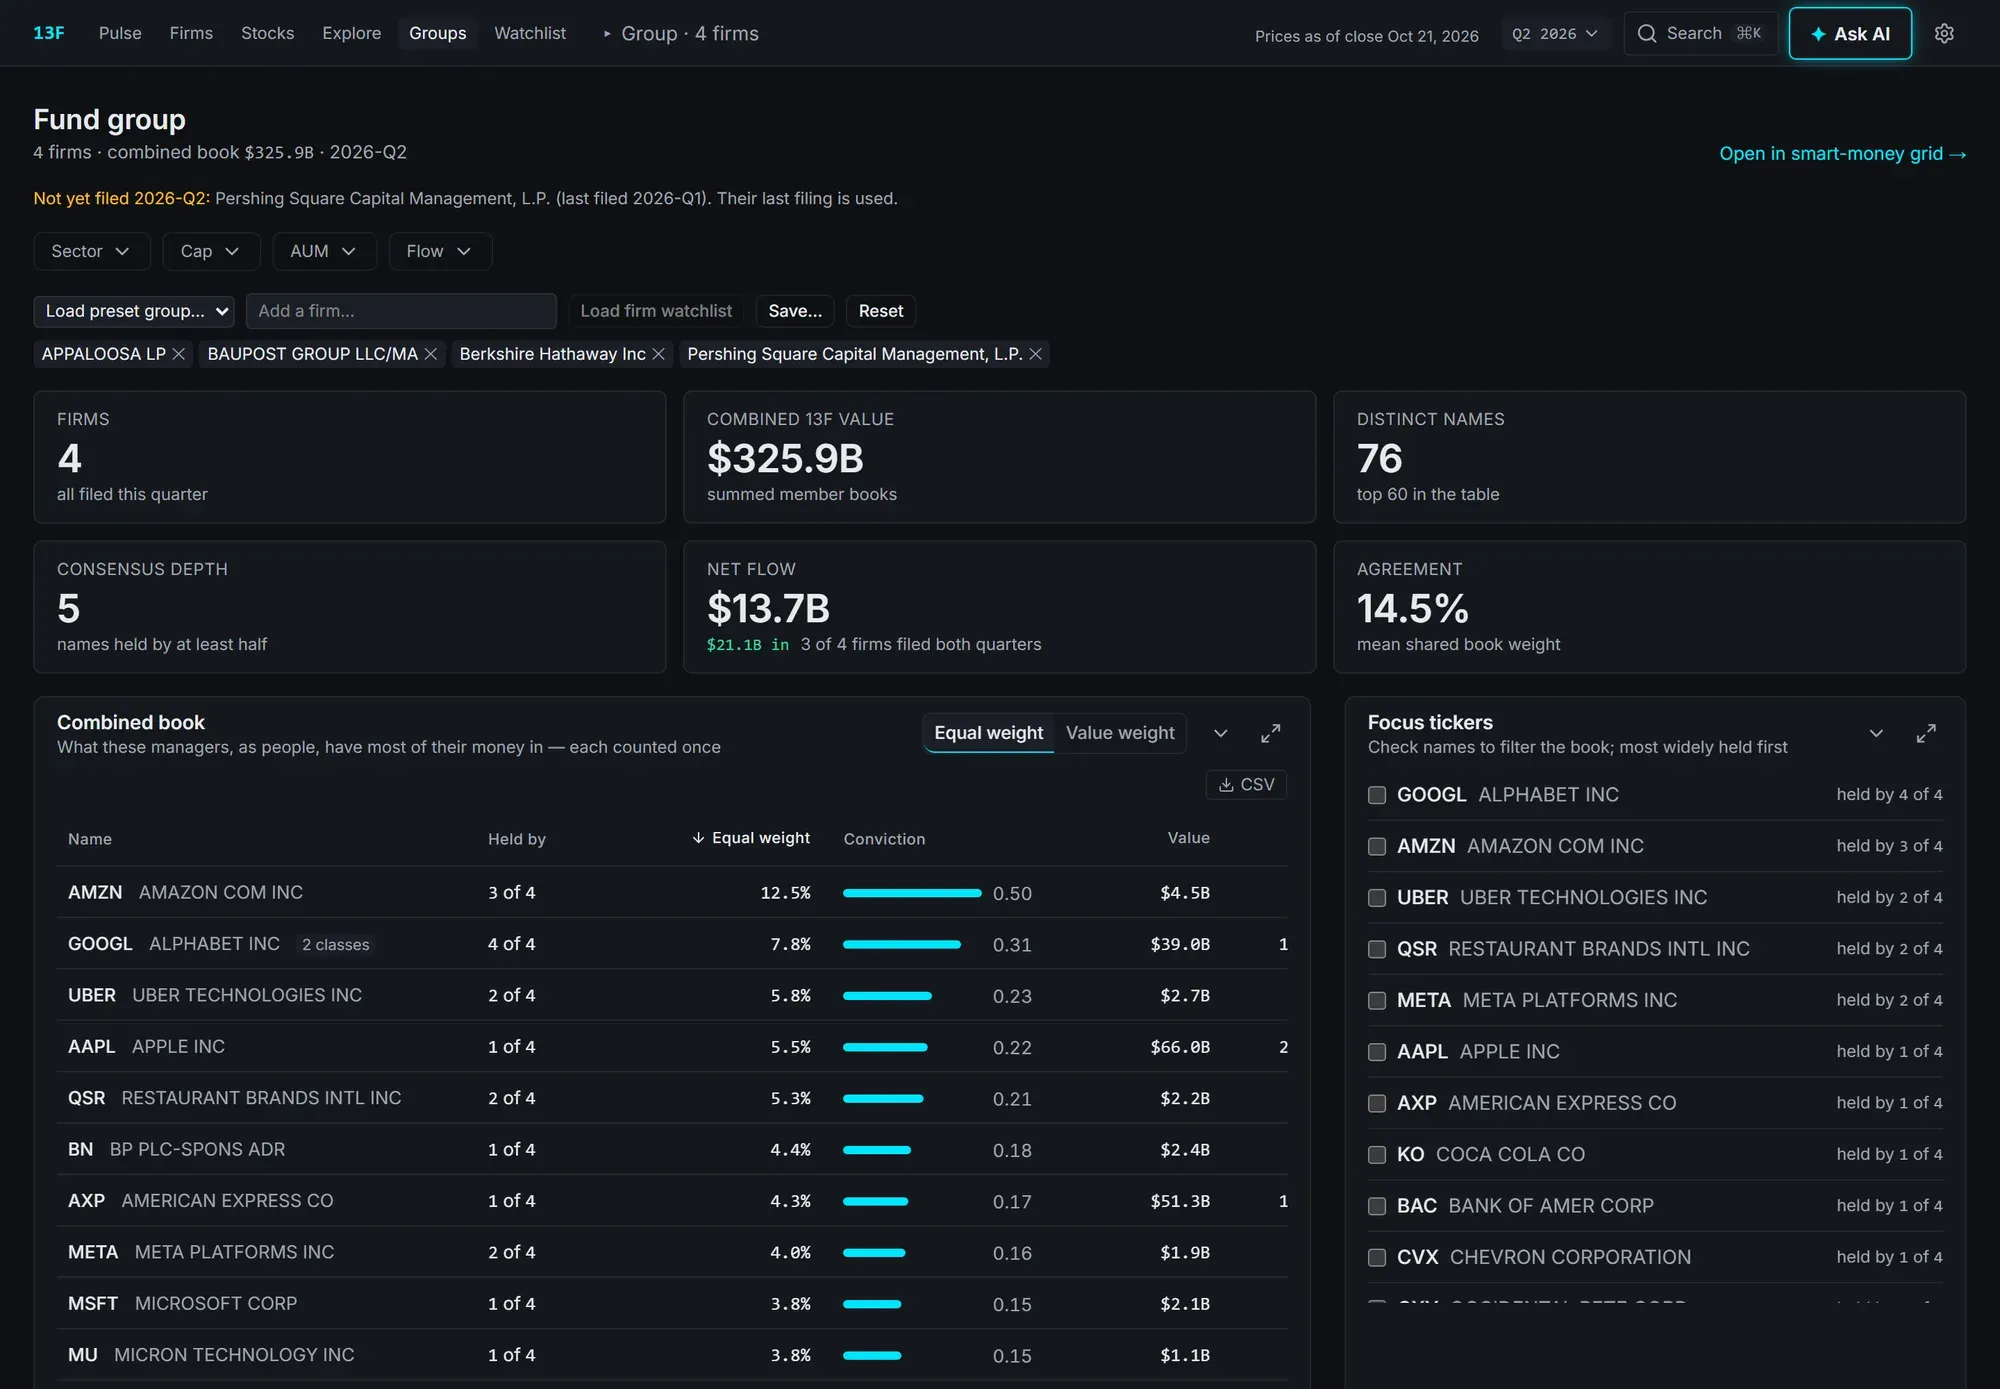
Put a set of managers side by side: their combined book, what they agree on, net flow, and where they disagree. Save your own groups or start from a preset.

A fund group of four firms: combined book, consensus depth and agreement.

Manager leaderboard

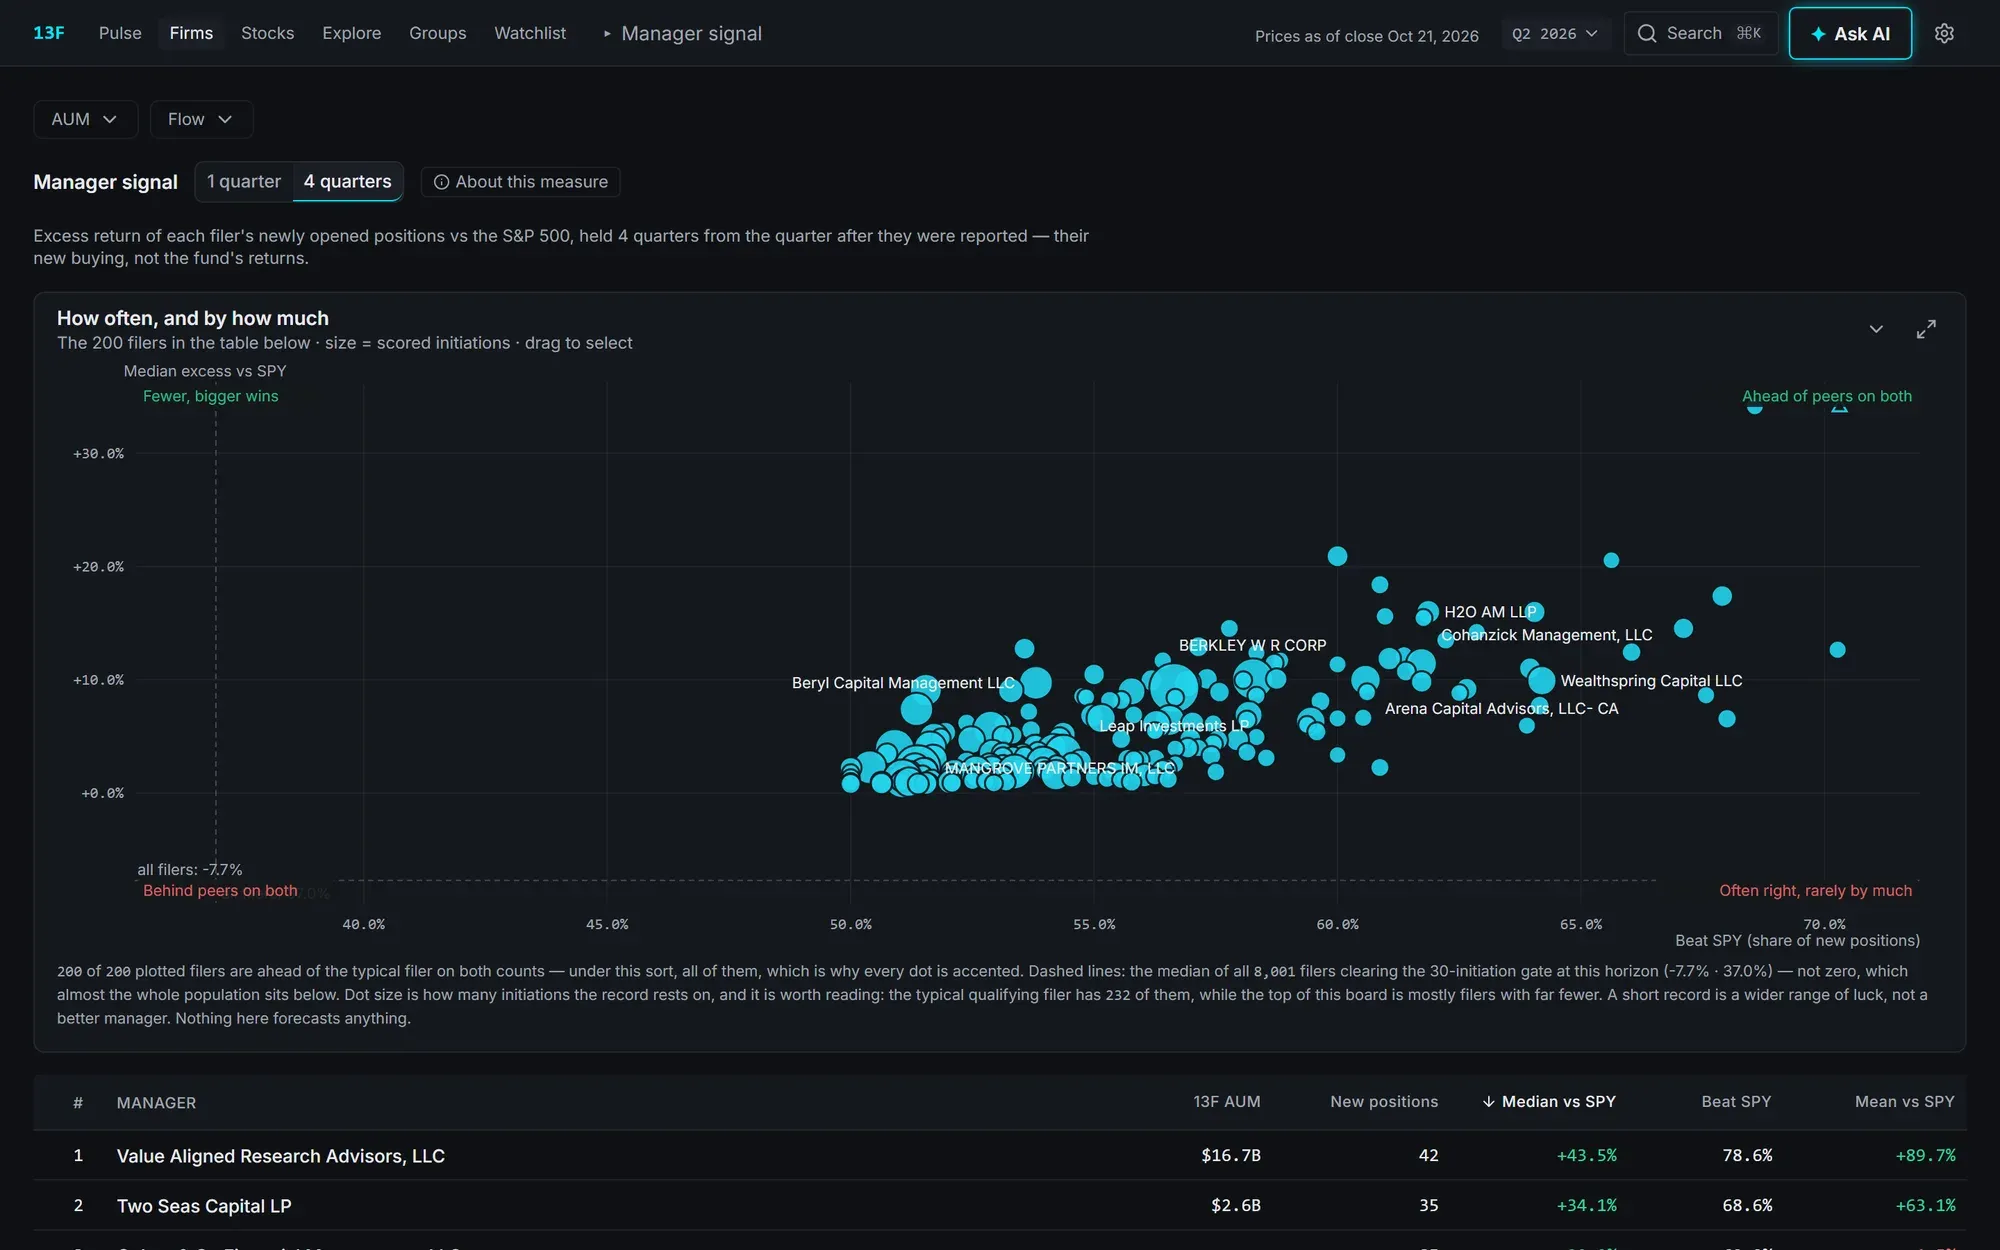
A track-record table of managers with sortable signal columns, each row one click from the firm’s page.

The manager leaderboard.

Every firm

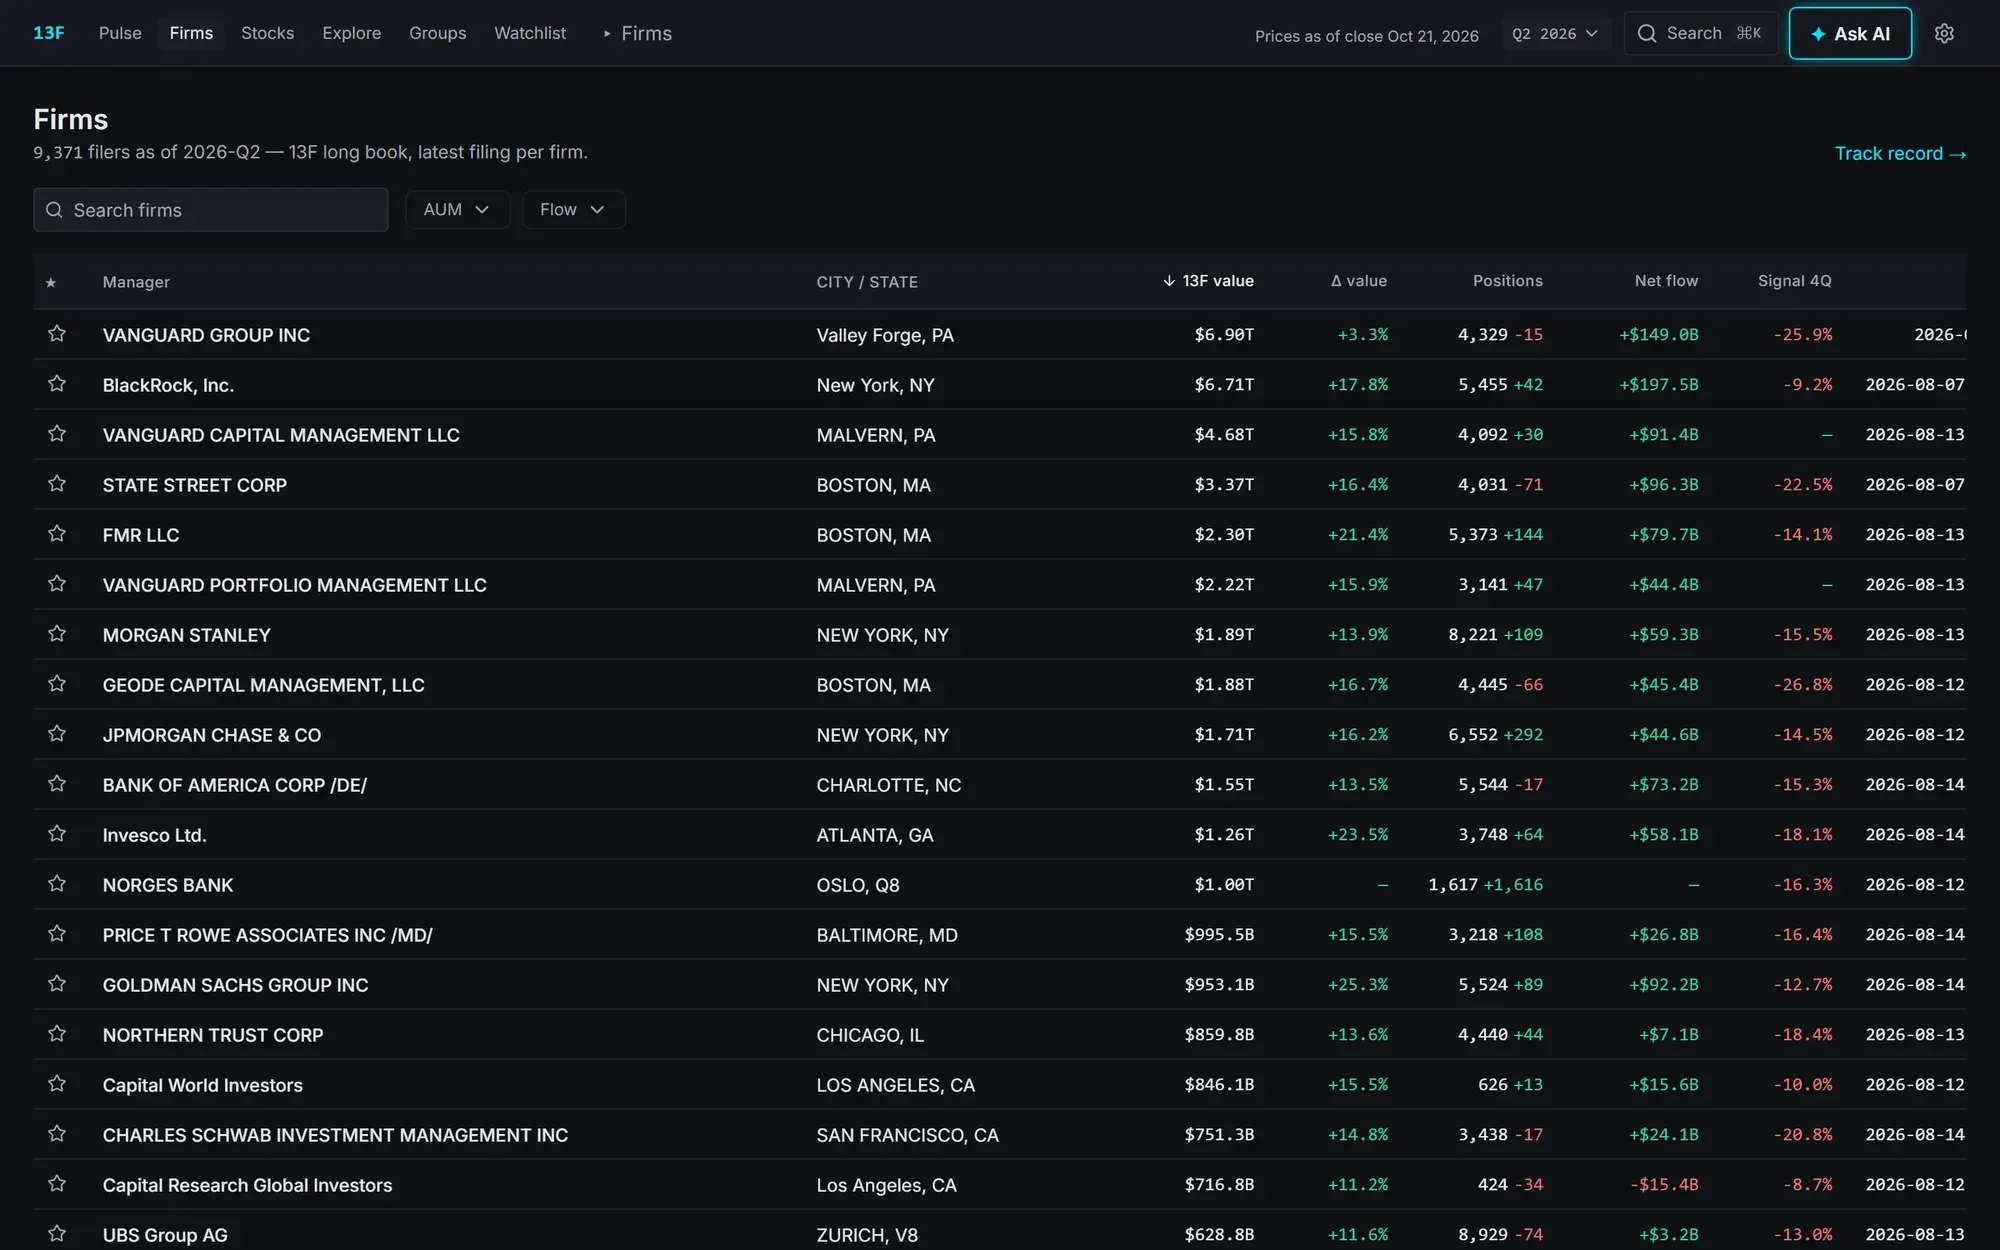
Search every filer at the latest quarter, filter by AUM and flow, sort any column, export to CSV.

The firm directory.

Every stock

Every security with a ticker, filtered by sector and size. Star the ones you follow and the watchlist shows what changed.

The stock directory.

Press ⌘K anywhere to jump to a firm or a ticker.

Ask AI

Ask the filings a question.

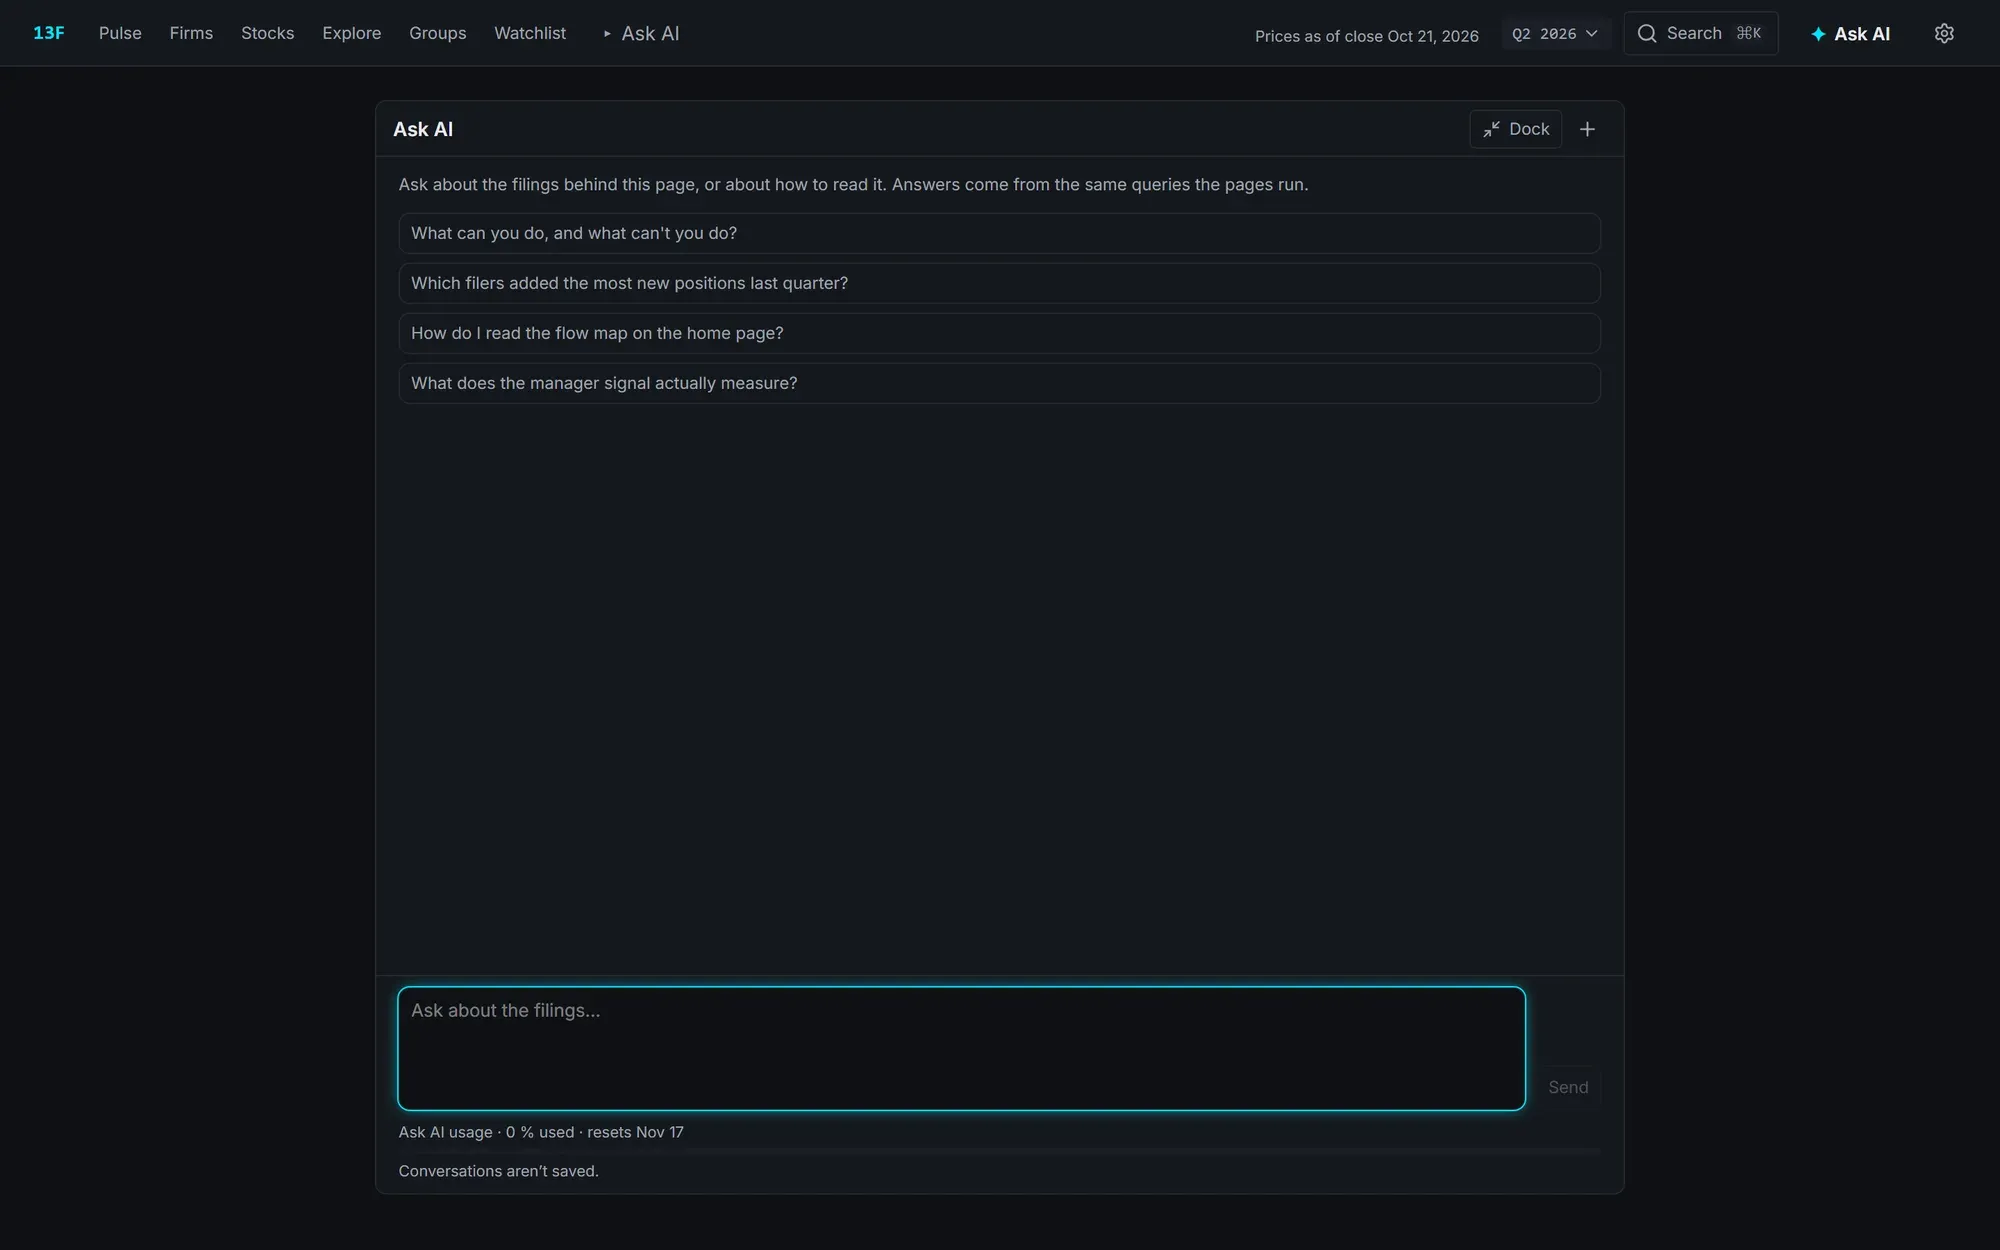
A side panel that answers questions about the 13F data and explains how to read any page or chart. Its answers come from the same queries the pages run, it links straight to the firm or stock it is talking about, and it can draw a chart inline.

  • “Which filers added the most new positions last quarter?”
  • “How do I read the flow map on the home page?”
  • “What does the manager signal actually measure?”

Included with every account, with a monthly allowance. Conversations aren’t saved. See the privacy policy for what is sent where.

The Ask AI panel with suggested questions.

The data

Where the numbers come from.

Public filings first, market data second, and our own judgement only where we write down the reason.

SEC EDGAR

Every 13F filing

Every filing, holding, value and put/call flag, the manager list and the securities by CUSIP, loaded from sec.gov.

Massive

Prices and reference data

Daily and quarter-end prices, splits, market cap and shares outstanding from 2016, plus tickers, names and exchanges, updated each trading evening.

SEC company data

Industries and sectors

Each issuer’s SIC industry code drives the sector view, with about fifty overrides, each with a written reason.

What 13F data is, and isn’t

13F filings are quarterly and arrive up to 45 days after each quarter ends. They cover only reportable long US equity and ADR positions: no shorts, cash, bonds or foreign listings, and not a fund’s full assets. The app shows this caveat on every data page, and tags quarters as provisional while filings are still arriving.

Pricing

Free during the beta.

Everything, including Ask AI, at no cost while the beta runs. At launch: one plan, $10 a month billed yearly or $15 month to month, with a 30-day free trial.

See this quarter’s flow now.

Sign in with your email or Google. No card during the beta.